14 March 2024
An Introduction to College Football Wins Above Average
PFF is excited to announce the launch of its new PFF Game Athleticism Rating (PFF GAR). PFF GAR has been developed using player-tracking data derived from computer vision technology and will give NFL teams yet another edge when making roster decisions.
Last week, PFF’s own Dr. Eric Eager unveiled PFF War, a metric to provide context around how valuable an individual player’s performance was over a given timeframe. The methodology, as outlined in the article, attempts to:
- Determine how good a given player was during a period of time (generally a season) using PFF grades;
- Map a player’s production to a “wins” value for his team using the relative importance of each facet of play;
- Simulate a team’s expected performance with a player of interest and with an average FBS player participating identically in his place;
- Take the difference in expected wins (i.e., Wins Above Average).
Using PFF’s unique blend of player grades and play-level participation data, we can provide a similar metric to the one derived for NFL for our college-level data.
The main distinction between the two is that we assume the replacement level in college football is an average FBS player. In other words, an average FBS player has a per-play grade of zero, which is adjusted for the strength of the opponent. In the NFL, a team of replacement-level players is expected to finish with a 3-13 NFL record, whereas in College, we don’t have a basis for replacement-level player wins and only judge solely on the expectation for how well an average FBS player would perform in the given situation. Instead of WAR, we outline a slightly different metric: WAA or Wins Above Average.
Like the NFL WAR version, we can utilize this metric to highlight important aspects that are specific to college football. Please note, PFF only has college football data dating back to 2014, so these numbers only span the PFF College era (2014-2019).
POSITIONAL VALUE
Everyone understands the value of quality quarterback play, especially in the NFL. Comparing college to the NFL, though, quarterbacks are actually slightly more valuable compared to other positions, with their value over twice as much as the next closest position in college. The other interesting tidbit hidden within College WAA is that cornerback is the second-most valuable position and exceeds the wide receiver position, unlike in the NFL. The position value rankings are quarterbacks, cornerbacks, wide receivers then defensive linemen.
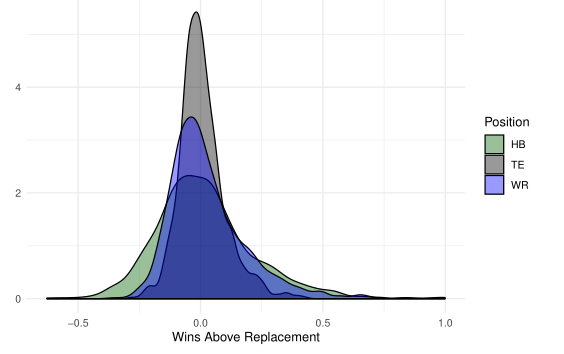
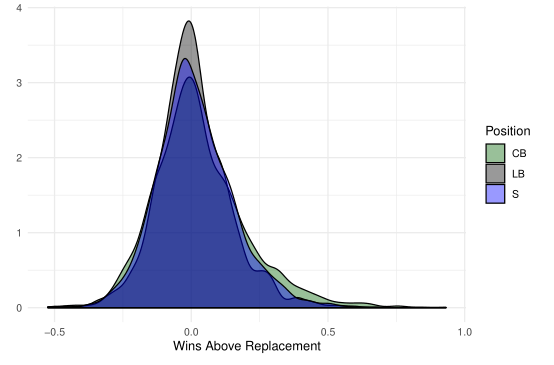
Figure: WAR for offensive and defensive skill position players. Minimum 250-snap threshold.
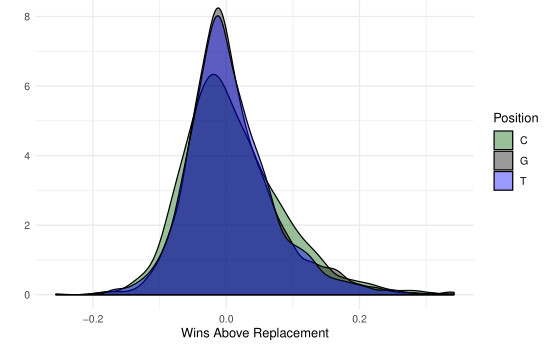
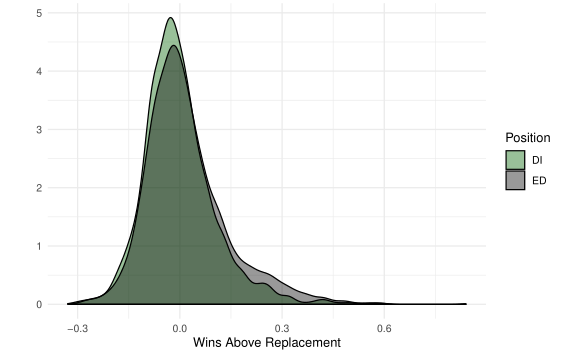
Figure: WAR for offensive and defensive linemen. Minimum 250-snap threshold.
BEST PLAYERS
Over the course of the PFF era, we have had several quality performances from quarterbacks, but no player was more valuable to his team than Marcus Mariota when he was the signal-caller for the Oregon Ducks.
| Season | Player | Team | Games | WAA |
| 2014 | Marcus Mariota | Oregon | 15 | 2.360 |
| 2018 | Kyler Murray | Oklahoma | 14 | 2.331 |
| 2017 | Baker Mayfield | Oklahoma | 14 | 2.324 |
| 2019 | Joe Burrow | LSU | 13 | 2.156 |
| 2015 | Matt Johnson | Bowling Green | 14 | 2.067 |
| 2016 | Baker Mayfield | Oklahoma | 13 | 1.970 |
| 2016 | Deshaun Watson | Clemson | 15 | 1.811 |
| 2015 | Jared Goff | California | 13 | 1.745 |
| 2015 | Baker Mayfield | Oklahoma | 13 | 1.698 |
| 2015 | Nick Mullens | Southern Miss | 14 | 1.635 |
HEISMAN TROPHY WINNERS
Most seasons, the respective voters were correct in giving the Heisman Trophy to the most valuable player in college football. Only two years during the PFF era did it appear like there was an argument for a different player than the one who was selected for the Heisman.
| Season | Player | Team | Games | WAA |
| 2014 | Marcus Mariota | Oregon | 15 | 2.360 |
| 2015 | Derrick Henry | Alabama | 15 | 0.351 |
| 2016 | Lamar Jackson | Louisville | 13 | 1.029 |
| 2017 | Baker Mayfield | Oklahoma | 14 | 2.324 |
| 2018 | Kyler Murray | Oklahoma | 14 | 2.331 |
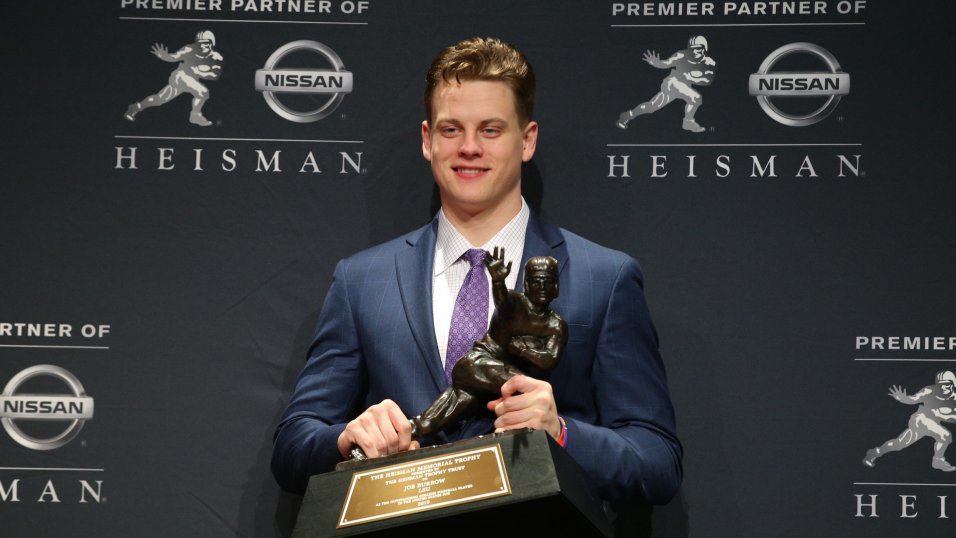
| 2019 | Joe Burrow | LSU | 13 | 2.156 |
HEISMAN TROPHY SNUBS
Heisman Trophy voters have hit the nail on the head over the past three seasons, but two snubs stick out during the PFF era.
In 2015, Derrick Henry finished 136th in our WAA metric. It was a down year for brilliant individual performances from players on dominant teams, but three players deserved the award more, based solely on our metric.
| Season | Player | Team | WAA |
| 2015 | Matt Johnson | Bowling Green | 2.067 |
| 2015 | Jared Goff | California | 1.745 |
| 2015 | Baker Mayfield | Oklahoma | 1.698 |
The 2016 season was much less of a miss by the committee, with Lamar Jackson finishing seventh according to our metric. He beat out a talented group of quarterbacks in what was a stacked field of Heisman candidates.
| Season | Player | Team | WAA |
| 2016 | Baker Mayfield | Oklahoma | 1.970 |
| 2016 | Deshaun Watson | Clemson | 1.811 |
| 2016 | Mason Rudolph | Oklahoma State | 1.482 |
| 2016 | Mike White | Western Kentucky | 1.385 |
| 2016 | Patrick Mahomes | Texas Tech | 1.152 |
| 2016 | Mitchell Trubisky | UNC | 1.092 |
| 2016 | Lamar Jackson | Louisville | 1.029 |
BEST NON-QUARTERBACKS
It is no surprise that quarterbacks dominate the list of most valuable contributors. When removing quarterback play, we get an interesting list of offensive skill position players who dominated touches in college and quality defensive backs who had a big impact on the opposing passing game. As a true freshman, Derek Stingley Jr. was our most valuable non-quarterback in 2019, and he was followed closely by SMU wide receiver James Proche.
| Season | Player | Team | WAA |
| 2016 | Kareem Hunt | Toledo | 0.999 |
| 2015 | Christian McCaffrey | Stanford | 0.994 |
| 2014 | Ezekiel Elliott | Ohio State | 0.939 |
| 2017 | Josh Jackson | Iowa | 0.932 |
| 2014 | Amari Cooper | Alabama | 0.856 |
| 2019 | Derek Stingley Jr. | LSU | 0.850 |
| 2017 | Mike Hughes | UCF | 0.848 |
| 2014 | James Conner | Pittsburgh | 0.844 |
| 2018 | Quinnen Williams | Alabama | 0.840 |
| 2017 | Devin Singletary | Florida Atlantic | 0.823 |
| 2014 | Will Parks | Arizona | 0.784 |
| 2018 | Byron Murphy | Washington | 0.753 |
| 2016 | Adoree' Jackson | USC | 0.748 |
| 2014 | Vernon Hargreaves III | Florida | 0.748 |
| 2018 | Andy Isabella | Umass | 0.743 |
| 2016 | Mike Williams | Clemson | 0.742 |
| 2016 | Dede Westbrook | Oklahoma | 0.741 |
| 2019 | James Proche | SMU | 0.726 |
BEST COLLEGE TEAMS
Last year’s national championship game featured two teams that were not only the class of the 2018 season but teams that also still sit atop our metric for best overall teams during the PFF College era. Alabama squads are scattered throughout this list, as are two teams in our current college football playoff, but the latter outfits could very well continue to move up this list over the course of their remaining two games.
| Team | Season | Total WAA |
| Alabama | 2018 | 7.600 |
| Clemson | 2018 | 6.938 |
| Alabama | 2016 | 6.667 |
| Oklahoma | 2017 | 6.606 |
| Ohio State | 2019 | 6.288 |
| LSU | 2019 | 6.208 |
| Alabama | 2015 | 5.806 |
| Clemson | 2016 | 5.571 |
| Ohio State | 2017 | 5.547 |
| Washington | 2016 | 5.365 |
BEST TEAMS THAT DIDN’T GET INTO THE CFP
For the most part, assigning value at a team level has been something the playoff committee has handled well. Only a few situations stick out as far as teams that should have gotten into the College Football Playoff but didn’t.
| Team | Season | Total WAA |
| Ohio State | 2017 | 5.547 |
| Georgia | 2018 | 4.651 |
| Washington | 2018 | 4.310 |
| Wisconsin | 2017 | 4.182 |
| Michigan | 2016 | 3.995 |